Brushing in Scatterplots with D3 and Quadtrees
One of the most common interaction idioms for data visualization is to select by clicking and dragging, also known as brushing. In this post, I'll focus on how to implement brushing in a scatterplot with D3 through the use of two packages: d3-brush and d3-quadtree. The main brushing interaction comes from d3-brush, while efficient look-up of what is covered by the brush is done via d3-quadtree. Handy helper functions for making this easier are available in my vis-utils repo.
Building a Basic Scatterplot
To get details on how to build a basic scatterplot and some of the terminology I typically use when discussing them, see my other post on adding Voronoi-based interaction to scatterplots. In this post, we'll build up from that same base scatterplot.
Adding a Brush
There are really two main steps to getting brushing working in a scatterplot:
- Add the brush interaction with visual feedback
- Interpret what is selected by the brush and update the vis accordingly
Let's start by using d3-brush to add in the brush interaction!
Showing the Brush
It turns out this is really easy. There are two things you need to do: create the brush generator then call it on a <g> tag.
// create the d3-brush generator
const brush = d3.brush()
  .extent([[0, 0], [plotAreaWidth, plotAreaHeight]])

// attach the brush to the chart
const gBrush = g.append('g')
  .attr('class', 'brush')
  .call(brush);
In the above code, we create brush, a brush generator that covers the rectangular area where dots are plotted in the chart. This prevents the user from being able to select the axis region (see my other post for why I call the dimensions plotAreaWidth, plotAreaHeight). Now, similar to how we generate axes in D3, we just call .call(brush) on a <g> tag and D3 works its magic to enable a brush.
Note: d3.brush() creates a 2D brush. If you wanted a 1D brush, try d3.brushX() or d3.brushY(). See the docs for more details.
At this point, our chart looks something like:
<svg>
  <g transform="translate(paddingLeft paddingTop)">
    ... the chart ...
    <g class="brush">... children generated by `brush` ...</g>
  </g>
</svg>
I've put the brush group below the rest of the chart so that it overlaps everything else. This ensures that the mouse handler overlay is not obstructed by anything and thus receives all mouse events.
Not bad. D3 generously provides us with a brush that is really user friendly: you can click and drag to initialize it, resize by dragging the edges, and even move it around by dragging the rectangle. If you want to change the styling of the box that is rendered, modify the element .selection inside the brush <g> tag.
Making the Brush Actually Do Something
We've got something that looks like a brush, and while that's cool and all, it would be better if it actually did something. We'll push forward and see how we can use quadtrees to efficiently find the points covered by the brush and then highlight them on screen.
The first step is to hook into events that d3-brush provides. We will provide a handler updateBrush for when the brush changes and when it finishes. Just like all other D3 code, we use .on() to attach to the desired events:
const brush = d3.brush()
  .extent([[0, 0], [plotAreaWidth, plotAreaHeight]])
  .on('brush end', updateBrush);
Now, what does updateBrush do? It's job is to find which points are highlighted by the brush and then update them accordingly. Through the object d3.event, we can read a property called selection which gives us the rectangular dimensions of the brush in the form [[left, top], [right, bottom]]. We can then use those dimensions to figure out which items are selected by the brush.
The naive method would be to simply iterate over our data and find which points are covered by the brush:
function naiveUpdateBrush() {
  const { selection } = d3.event;
  const brushedNodes = data.filter(d =>
    // helper function that returns true if the point is
    // within the selection rect
    rectContains(selection, [xScale(d.x), yScale(d.y)])
  );

  // helper to visualize the highlighted data points
  // see the full source code for details
  highlightBrushed(brushedNodes);
}
This works fine for a small number of points, but it requires you to scan through every single point in the chart every time the brush changes. This callback is called very frequently while the brush is moved around, so we want it to be as fast as possible to prevent a laggy user experience. However, if you don't notice any problem with this simple method, use it! There's no point prematurely optimizing if you are not currently experiencing any issues.
Quadtree Optimization
Similar to how we can use a binary tree to skip nodes we search through when performing a binary search, we can use a quadtree to skip 2D regions of our scatterplot. This allows us to compare fewer points in the chart, reducing the run time of our updateBrush function.
Quadtrees essentially breakdown our data into nested rectangular regions where the leaves only contain a single element. Our chart with a quadtree overlaid looks like this:

So how do we use one? The first step is to create a quadtree using d3.quadtree():
// generate a quadtree for faster lookups for brushing
const quadtree = d3.quadtree()
  .x(d => xScale(d.x))
  .y(d => yScale(d.y))
  .addAll(data);
It's a similar interface to other D3 components: we specify how to interpret x and y in our data and then pass it our data for it to generate itself from. And just like that we have a quadtree for our dataset.
For performance, we only generate the quadtree once and then reuse it each time we brush. The optimization part comes in by traversing the quadtree via its visit() function instead of scanning through all data points as we did above.
Here's our updated updateBrush() function that uses the quadtree:
// callback when the brush updates / ends
function updateBrush() {
  const { selection } = d3.event;

  // if we have no selection, just reset the brush highlight to no nodes
  if (!selection) {
    highlightBrushed([]);
    return;
  }

  // begin an array to collect the brushed nodes
  const brushedNodes = [];

  // traverse the quad tree, skipping branches where we do not overlap
  // with the brushed selection box
  quadtree.visit((node, x1, y1, x2, y2) => {
    // check that quadtree node intersects
    const overlaps = rectIntersects(selection, [[x1, y1], [x2, y2]]);

    // skip if it doesn't overlap the brush
    if (!overlaps) {
      return true;
    }

    // if this is a leaf node (node.length is falsy), verify it is within the brush
    // we have to do this since an overlapping quadtree box does not guarantee
    // that all the points within that box are covered by the brush.
    if (!node.length) {
      const d = node.data;
      const dx = xScale(d.x);
      const dy = yScale(d.y);
      if (rectContains(selection, [dx, dy])) {
        brushedNodes.push(d);
      }
    }

    // return false so that we traverse into branch (only useful for non-leaf nodes)
    return false;
  });

  // update the highlighted brushed nodes
  highlightBrushed(brushedNodes);
}
The main points to take away from this approach is that we do two things while traversing the tree:
- We check to see if the current node of the tree overlaps the brush by using the
rectIntersectscommand. This allows us to skip entire branches of the tree if they do not overlap the brush at all. - Once we reach a leaf node (determined by not having
node.length), we verify that the point inside that leaf is actually contained within the brush. This is necessary since the quadtree region is larger than the point and so it can commonly be the case that the brush covers a leaf node's quadtree region, but does not cover the point itself.
To facilitate doing these checks, I use two functions: rectIntersects and rectContains. These are available in my vis-utils repo, but are also reproduced in the source code of this example for convenience. If you just want a single function call to tell you what's contained under a brush, the vis-utils functions filterInRect and filterInRectFromQuadtree do the same thing as is described in this post.
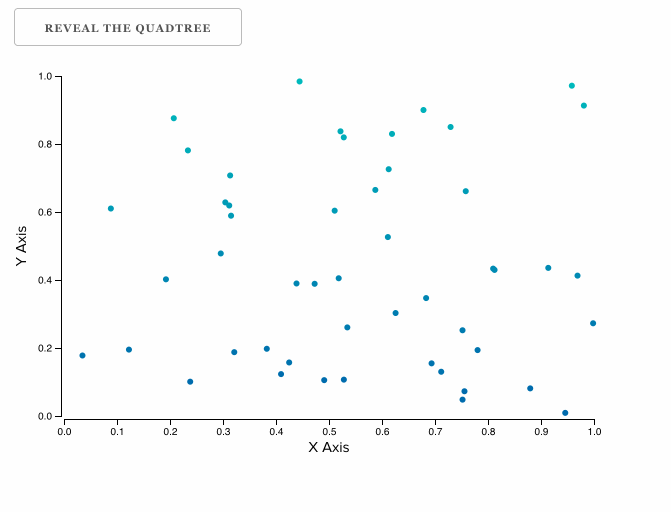
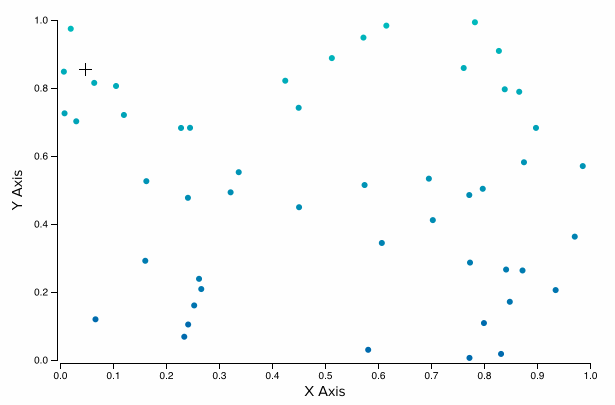
Here's a slowed down animation of how this all works in practice (you can see this yourself on the demo by revealing the quadtree):
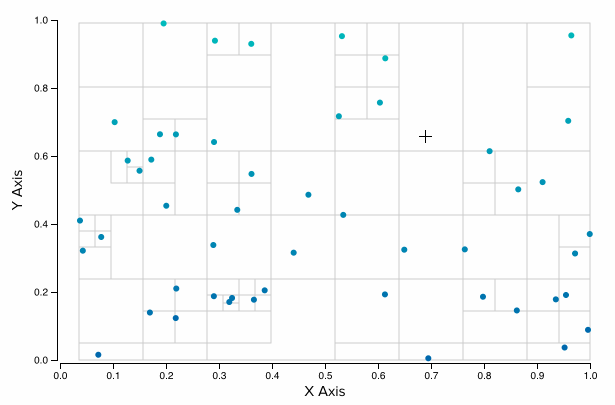
Each quadtree node that is visited is rendered with a translucent gray background. We can see that more than half of the chart is pruned from the search!
Shout out to Irene Ros, Director of Data Vis at Bocoup, for the encouragement to visually demonstrate the quadtree traversal!
Bonus: Add Voronoi Hover Interaction
If you want to support both having hover behavior and a brush, you can do so using the Voronoi-based interaction I discussed in my previous post by attaching the Voronoi mouse listeners to the brush's .overlay element. See the source code for details.
Conclusion
That wraps it up! We can now add brushing and hover behavior to our scatterplots with D3. Keep in mind that jumping directly to using quadtrees for your scatterplots may be unnecessary if you are only working with a small number of data points-- sometimes simpler can be better. But in the event that you do want that optimization, I hope that this post has helped you understand how to do it!
As always, if you have any questions or comments feel free to reach out to me on twitter @pbesh.