Beautifully Animate Points with WebGL and regl
- May 26, 2017
- 13 min read
- Demo

I've got a fever, and the only prescription is more points dancing across my screen. In a previous blog post, I covered how to animate thousands of points using HTML5 canvas and d3, but that approach doesn't scale too well beyond 10,000 points. Perhaps you can push it to 20,000 if you don't mind dropping a frame here or there, but if you need that buttery smoothness, you're going to want to switch from the 2D canvas to using WebGL. And who doesn't need buttery smoothness?
Now I know what you're thinking, WebGL? I know what Web is, but that GL business? Sounds terrifying. And for good reason, it's a damn nightmare in here, but hey we need more points! We can't give up now. Luckily, a few brave souls have written abstractions on top of WebGL to make it easier to work with. In this post, I'll explore using regl, one such library by Mikola Lysenko to help do the heavy lifting.
Take note that I am a data visualization guy, not a 3D graphics guy, so my approach is based on my experience in that area.
Quick links to all 4 demos as blocks:
- Drawing 100,000 points in regl
- Animate 100,000 points with regl - I
- Animate 100,000 points with regl - II
- Animate 100,000 points with regl - III
So, why do we need WebGL anyway?
The problem with sticking with the 2D canvas is that we typically have a big old for loop iterating over each point and drawing it on screen with something like context.fillRect(). Since we want to maintain frame rate of 60 frames per second, we're going to need to complete all of our updating and drawing before the browser wants to draw the next frame. With 60 frames a second, that works out to less than 17ms to do all of our calculations and updates. Once we get enough iterations in our loop, we're going to exceed that threshold and end up dropping frames occasionally, making for a jumpy and far less satisfying animation.
By switching to using WebGL, we can pass over some of the effort spent iterating over points from the CPU to the GPU. The way we do that is with shaders. Luckily for us (perhaps), regl makes it really easy to dive right in and start playing around with them.
Super Simple Shader Primer
Look, I'm no WebGL or shader expert, I just want swarms of points to storm across my screen. If you really want to learn how shaders work, you should probably read some other resource like the Book of Shaders. Alternatively, you can stare at the examples at regl.party while banging your head against the wall until it begins to make a little sense (like I did).
With that disclaimer in mind, here's a basic rundown. You've got two types of shaders: a vertex shader and a fragment shader. Shaders are just programs that run on the GPU, typically to produce some graphical output. A vertex shader updates a special value called gl_Position that determines where a vertex is positioned on screen. A fragment shader updates a special value called gl_FragColor that determines which color a pixel will be. Vertex shaders are called for all points or vertices passed in and fragment shaders for all pixels.
That covers a very basic (and almost my complete) understanding of shaders. Disappointing, right? I know and I'm sorry. Turns out, however, that's almost all you need to know to get started, so let's try drawing with them before we get to animating.
Drawing 100,000 points with shaders in regl

Here's a link to a working example. If you want to take a look at all the example code at once, check it out.
Now before we get to anything too fancy, let's start by defining a few constants and creating our "dataset" of 100,000 points.
const numPoints = 100000;

// the size of the points we draw on screen
const pointWidth = 4;

// dimensions of the viewport we are drawing in
const width = window.innerWidth;
const height = window.innerHeight;

// random number generator from d3-random
const rng = d3.randomNormal(0, 0.15);

// create initial set of points
const points = d3.range(numPoints).map(i => ({
  x: (rng() * width) + (width / 2),
  y: (rng() * height) + (height / 2),
  color: [0, Math.random(), 0],
}));
Ok, so we have some points. Notice anything a bit strange? The colors are arrays!
Colors in WebGL are formatted as arrays of length four (red, green, blue, alpha) with values ranging from 0 to 1 instead of their typical string format used in HTML and CSS. The code above produces points with colors ranging from rgb(0, 0, 0) to rgb(0, 255, 0). Since we're not dealing with alpha in this example, I've excluded the fourth value from the array (we'll fill it in as 1 later).
The x and y values that we specified will range from 0 to width and 0 to height, also known as pixel space. This coordinate system is what we're used to when working with normal canvas or svg, but in WebGL everything lives in normalized device coordinates, which is a fancy way of saying the top left corner is at (-1, 1) and the bottom right corner is at (1, -1). We'll keep the width and height variables around so we can scale our x and y positions appropriately in our shader.
The regl Draw Loop
So we have a collection of points, now let's set up the regl drawing loop before diving into the nitty gritty of the shaders.
// start the regl draw loop
regl.frame(() => {
  // clear the buffer
  regl.clear({
    // background color (black)
    color: [0, 0, 0, 1],
    depth: 1,
  });

  // draw the points using our created regl func
  // note that the arguments are available via `regl.prop`.
  drawPoints({ // we'll get to this function in a moment!
    pointWidth,
    stageWidth: width,
    stageHeight: height,
  });
});
Not much going on here: we clear the background with the color black and then we call drawPoints with a few properties, but with this code we now have a loop running 60 times a second and attempting to draw points on the screen.
The drawPoints Function (aka Shader Magic)
All right, since regl is really focused around shaders, all of the work comes out when writing shader code. We can create our drawPoints function, which will essentially connect all the information to our shaders in a way WebGL understands. Thanks regl! I really didn't want to do that myself.
The basic structure looks like this:
const drawPoints = regl({
  frag: 'the fragment shader string (filled in later)',
  vert: 'the vertex shader string (filled in later)',

  attributes: {
    // each of these gets mapped to a single entry for each of
    // the points. this means the vertex shader will receive
    // just the relevant value for a given point.
    position: points.map(d => [d.x, d.y]),
    color: points.map(d => d.color),
  },

  uniforms: {
    // by using `regl.prop` to pass these in, we can specify
    // them as arguments to our drawPoints function
    pointWidth: regl.prop('pointWidth'),

    // regl actually provides these as viewportWidth and
    // viewportHeight but I am using these outside and I want
    // to ensure they are the same numbers, so I am explicitly
    // passing them in.
    stageWidth: regl.prop('stageWidth'),
    stageHeight: regl.prop('stageHeight'),
  },

  // specify the number of points to draw
  count: points.length,

  // specify that each vertex is a point (not part of a mesh)
  primitive: 'points',
});
Let's breakdown that structure above.
- frag: This is where we'll put the fragment shader code. It is passed in just as a string.
- vert: This is where we'll put the vertex shader code, also a string.
- attributes: Here we pass data into the drawPoints function definition. A single entry from each of the arrays specified here is passed to the vertex shader, corresponding with the point it is drawing. So each vertex shader will receive a
positionarray with two entries[x, y](note: WebGL calls an array with 2 entries avec2for vector of length 2). - uniforms: These are values that are the same for all points. Note that we use
regl.prophere, which makes it so we can change these values by modifying the argument to thedrawPointsfunction accordingly when we call it from the draw loop. - count: The total number of points being drawn. I believe this is important for divvying up the attributes and knowing how many vertices to draw.
- primitive: We specify that each vertex should be drawn as a point, as opposed to all being part of a single mesh. Using
pointis a great choice for particle system effects like what we're going for here.
Ok, with all that aside, let's dive into the shaders.
The Fragment Shader
To specify the fragment shader, we write it as a multi-line string. We'll keep this one as simple as we can and just set the pixel color to whatever the vertex shader passed in.
// set the precision of floating point numbers
precision highp float;

// this value is populated by the vertex shader
varying vec3 fragColor;

void main() {
  // gl_FragColor is a special variable that holds the color
  // of a pixel
  gl_FragColor = vec4(fragColor, 1);
}
Note that varying basically means the vertex shader populates the value of this variable. Also recall how we only stored colors as arrays of length 3 (vec3), so we append a 1 to the end for the alpha channel.
The Vertex Shader
The vertex shader is a bit more complex, but the basics are shown below:
// per vertex attributes
attribute vec2 position;
attribute vec3 color;

// variables to send to the fragment shader
varying vec3 fragColor;

// values that are the same for all vertices
uniform float pointWidth;
uniform float stageWidth;
uniform float stageHeight;

void main() {
  // update the size of a point based on the prop pointWidth
  gl_PointSize = pointWidth;

  // send color to the fragment shader
  fragColor = color;

  // gl_Position is a special variable that holds the position
  // of a vertex.
  gl_Position = vec4(position, 0.0, 1.0);
}
First, we update gl_PointSize, a special value that determines the size points are rendered on screen based on our property pointWidth. Then we save the attribute color into the varying fragColor so that the fragment shader can read its value since it does not have access to attributes. Finally, we update gl_Position to indicate where the vertex is positioned.
Now if you'll recall, the points in WebGL space are not the same as in normal screen pixel space-- they range from (-1, 1) to (1, -1). Since we laid out our point positions in pixel space, we'll need to normalize them in our shader. Here's the full code including normalization:
// per vertex attributes
attribute vec2 position;
attribute vec3 color;

// variables to send to the fragment shader
varying vec3 fragColor;

// values that are the same for all vertices
uniform float pointWidth;
uniform float stageWidth;
uniform float stageHeight;

// helper function to transform from pixel space to normalized
// device coordinates (NDC). In NDC (0,0) is the middle,
// (-1, 1) is the top left and (1, -1) is the bottom right.
vec2 normalizeCoords(vec2 position) {
  // read in the positions into x and y vars
  float x = position[0];
  float y = position[1];

  return vec2(
    2.0 * ((x / stageWidth) - 0.5),
    // invert y to treat [0,0] as bottom left in pixel space
    -(2.0 * ((y / stageHeight) - 0.5)));
}

void main() {
  // update the size of a point based on the prop pointWidth
  gl_PointSize = pointWidth;

  // send color to the fragment shader
  fragColor = color;

  // scale to normalized device coordinates
  // gl_Position is a special variable that holds the position
  // of a vertex
  gl_Position = vec4(normalizeCoords(position), 0.0, 1.0);
}
That's right, you can create helper functions in shaders (like we did with normalizeCoords() above) and call them within your main() function. Pretty cool stuff.
At this point, we have all the necessary parts to draw 100,000 points on screen with regl and shaders. Check out the demo and full code here.
And Now Animate
Here's the live demo and full source code to get this initial animation working.
So, getting started drawing 100,000 points was pretty complicated. Luckily the jump from there to animating is relatively small. At this point we already have the GPU normalizing positions of the points and drawing them on screen. And we have a loop running just waiting to animate, so what's our strategy going to be?
I'm going to take a very similar approach to what I did for animating thousands of points on canvas, except this time all the interpolation of position is going to happen in a shader so we can use the GPU.
The basic animation process is:
- Store the current position of a point as its start position
- Run a layout function on the points to get their new positions and then store them as their end positions
- Tell the shader how far through the animation we are so it knows where to interpolate to
- Switch layouts after our animation completes
Laying out the Points
A layout algorithm can be any function that sets the x and y attribute on our point objects. The reason I've taken this approach is that it is a fairly common style to find in layout algorithms already made for D3, the industry standard library for data visualization on the web. For simplicity in these examples, I'll also set color so we can animate it easily. Here's an example layout algorithm that randomly positions points:
function blueNormalLayout(points) {
  // random number generator based on a normal distribution
  // with mean = 0, std dev = 0.15
  const rng = d3.randomNormal(0, 0.15);

  points.forEach(d => {
    // set the x and y attributes
    d.x = (rng() * width) + (width / 2);
    d.y = (rng() * height) + (height / 2);

    // blue-green color
    d.color = [0, 0.5, 0.9];
  });
}
Now when we animate between the points, all we need to do is keep track of their start position (let's call it sx, sy) or where they currently are, and their end position (tx, ty) based on wherever their new layout places them.
This can be done with the following code:
// make previous end the new beginning
points.forEach(d => {
  d.sx = d.tx;
  d.sy = d.ty;
  d.colorStart = d.colorEnd;
});

// layout points, updating x, y, and color attributes
layout(points);

// copy layout x, y, and color to end values
points.forEach((d, i) => {
  d.tx = d.x;
  d.ty = d.y;
  d.colorEnd = d.color;
});
The important part here is now our points contain both their start and end positions, not just their current position. This will allow the shader to interpolate between them easily. The basic shape of a point object is as follows:
{
  sx: start x position - number between 0 and width,
  sy: start y position - number between 0 and height,
  colorStart: array with 3 entries between 0 and 1,
  tx: end x position - number between 0 and width,
  ty: end y position - number between 0 and height,
  colorEnd: array with 3 entries between 0 and 1
}
Updating regl.frame to Animate
We need to update our callback in regl.frame so that it gets the duration and start time of the animation, and knows when it can switch to the next animation. The changes are relatively simple: we keep track of the time when the animation began so we can compute time elapsed, we pass in duration and start time as new props to our drawPoints function, and we check if we've exceeded the duration of the animation and if so, switch to the next layout.
let startTime = null; // in seconds
regl.frame(({ time }) => {
  // keep track of start time so we can get time elapsed
  // this is important since time doesn't reset when starting
  // new animations
  if (startTime === null) {
    startTime = time;
  }

  // clear the buffer
  regl.clear({
    // background color (black)
    color: [0, 0, 0, 1],
    depth: 1,
  });

  // draw the points using our created regl func
  // note that the arguments are available via `regl.prop`.
  drawPoints({
    pointWidth,
    stageWidth: width,
    stageHeight: height,

    // here we pass in the new props:
    duration,
    startTime,
  });

  // if we have exceeded the maximum duration, move on to the
  // next animation
  if (time - startTime > (duration / 1000)) {
    switchToNextAnimation(); // see live demo code for details
  }
});
Updating drawPoints for Animation
Previously we had attributes that stored the current position and color of each point, but now we want to work with both their start and end values. To do so, we'll modify our attributes as follows:
attributes: {
  // each of these gets mapped to a single entry for each of
  // the points. this means the vertex shader will receive
  // just the relevant value for a given point.
  positionStart: points.map(d => [d.sx, d.sy]),
  positionEnd: points.map(d => [d.tx, d.ty]),
  colorStart: points.map(d => d.colorStart),
  colorEnd: points.map(d => d.colorEnd),
},
We'll also need a couple new uniforms that contain information about the animation as a whole. In particular, we care about how much time has elapsed between the current frame and the beginning of the animation and how long the entire animation should take.
uniforms: {
  // by using `regl.prop` to pass these in, we can specify them
  // as arguments to our drawPoints function
  pointWidth: regl.prop('pointWidth'),

  // regl actually provides these as viewportWidth and
  // viewportHeight but I am using these outside and I want to
  // ensure they are the same numbers, so I am explicitly
  // passing them in.
  stageWidth: regl.prop('stageWidth'),
  stageHeight: regl.prop('stageHeight'),

  duration: regl.prop('duration'),
  // time in ms since the prop startTime (i.e. time elapsed)
  // note that `time` is passed by regl whereas `startTime`
  // is a prop passed to the drawPoints function.
  elapsed: ({ time }, { startTime = 0 }) =>
    (time - startTime) * 1000,
},
Here, duration will be another prop we pass in that represents the time for the animation to run in milliseconds. elapsed is a bit trickier - its value will be computed for each frame based on the function specified. The first argument time is populated by regl itself, while the second argument startTime is a prop that we are going to pass in. Note that time in regl is computed in seconds, so we multiply by 1000 to get milliseconds.
Update the Shader for Animation
We've reached the point where we have to dive back into our shader to update it to animate the points. Luckily for us, the changes are relatively small. In fact, we do not have to change our fragment shader at all! However, the vertex shader needs to be updated to know how far through the animation it is, and then to interpolate the start and end positions and colors accordingly.
Since we have elapsed and duration being passed as uniforms, we can compute how far through the animation we are by simply dividing them: elapsed / duration (and maxing out at 1). We can then use the amazingly useful mix(a, b) function which linear interpolates any two values -- even vectors -- to figure out our current positions and colors. Let's see how this shakes out inside our main() function:
// number between 0 and 1 indicating how far through the
// animation this vertex is.
float t = min(1.0, elapsed / duration);

// interpolate position
vec2 position = mix(positionStart, positionEnd, t);

// interpolate and send color to the fragment shader
fragColor = mix(colorStart, colorEnd, t);
Besides declaring the new variables at the top of the shader, those are the only changes we have to make! What a beautiful day.
Sadly, if you looked at the animation at this point, it would be a bit boring since we left all the magic of easing out. There's this amazing module system of pre-built shader helpers called glslify that contains a bunch of easing functions you can drop into your code, but for now we'll write our own. Let's take the cubic-in-out easing code from d3-ease and use it to create a new function in our shader:
// helper function to handle cubic easing (copied from d3)
// note there are premade ease functions available via glslify.
float easeCubicInOut(float t) {
  t *= 2.0;
  t = (t <= 1.0 ? t * t * t : (t -= 2.0) * t * t + 2.0) / 2.0;

  // for simplicity, max at 1 here
  if (t > 1.0) {
    t = 1.0;
  }

  return t;
}
All we have to do now is apply that function to our t value and we'll have some smoothly eased animation taking place and we're done! Here's the full animation vertex shader:
// per vertex attributes
attribute vec2 positionStart;
attribute vec2 positionEnd;
attribute vec3 colorStart;
attribute vec3 colorEnd;

// variables to send to the fragment shader
varying vec3 fragColor;

// values that are the same for all vertices
uniform float pointWidth;
uniform float stageWidth;
uniform float stageHeight;
uniform float elapsed;
uniform float duration;

// helper function to transform from pixel space to normalized
// device coordinates (NDC). In NDC (0,0) is middle, (-1, 1)
// is the top left and (1, -1) is the bottom right.
vec2 normalizeCoords(vec2 position) {
  // read in the positions into x and y vars
  float x = position[0];
  float y = position[1];

  return vec2(
    2.0 * ((x / stageWidth) - 0.5),
    // invert y since we think [0,0] is bottom left in pixel
    // space
    -(2.0 * ((y / stageHeight) - 0.5)));
}

// helper function to handle cubic easing (copied from d3)
// note there are premade ease functions available via glslify.
float easeCubicInOut(float t) {
  t *= 2.0;
  t = (t <= 1.0 ? t * t * t : (t -= 2.0) * t * t + 2.0) / 2.0;

  if (t > 1.0) {
    t = 1.0;
  }

  return t;
}

void main() {
  // update the size of a point based on the prop pointWidth
  gl_PointSize = pointWidth;

  // number between 0 and 1 indicating how far through the
  // animation this vertex is.
  float t;

  // drawing without animation, so show end state immediately
  if (duration == 0.0) {
    t = 1.0;

  // otherwise we are animating, so use cubic easing
  } else {
    t = easeCubicInOut(elapsed / duration);
  }

  // interpolate position
  vec2 position = mix(positionStart, positionEnd, t);

  // interpolate and send color to the fragment shader
  fragColor = mix(colorStart, colorEnd, t);

  // scale to normalized device coordinates
  // gl_Position is a special variable that holds the
  // position of a vertex
  gl_Position = vec4(normalizeCoords(position), 0.0, 1.0);
}
Once again, here's the live demo and full source code of this animation.
Conclusion
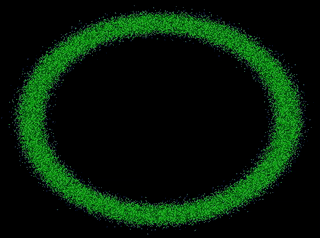
So there you have it, simple point based animation in regl. We covered how to draw 100,000 points and a basic approach to animating them. However, with these same ideas, you can do even cooler animations when you start using different layouts.
Here's an example of animating through a set of visually pleasing layouts, similar to what was done in my canvas post:
And another example that uses actual data values for laying out the points:
Hope you enjoyed it! Feel free to reach out to me on twitter @pbesh if you have any questions or comments.